diagram
noun diagram
ˈdaɪəɡræm
A simple drawing to explain something
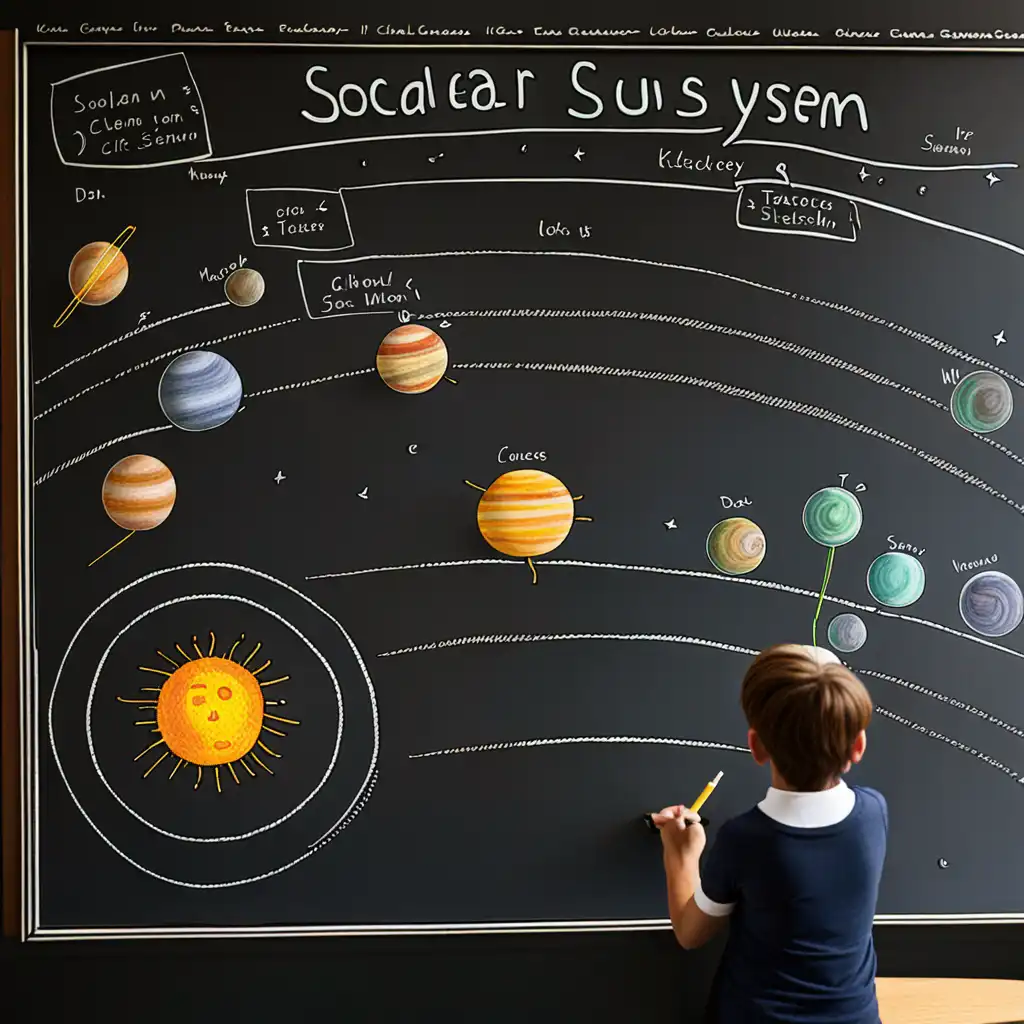
The teacher drew a diagram on the board to explain the solar system.
diagram
ˈdaɪəɡræm
読み込み中…
ˈdaɪəɡræm
A simple drawing to explain something
The teacher drew a diagram on the board to explain the solar system.

ˈdaɪəɡræm
To make a simple drawing to explain something
She diagrammed the sentence to show its structure
音声を読み込めませんでした。しばらくしてからもう一度お試しください。
A diagram is a picture, drawing or chart that shows how something works or is related to other things. It is often used to help explain an idea or show information in a visual way. Diagrams can be used in many subjects, such as science, math, and engineering. For example, in math, a diagram can show the different parts of a shape and how they fit together. In science, a diagram can show how a plant grows or how a machine works. In general, diagrams can be a useful tool for understanding complex concepts or conveying information in a simplified way.
A blueprint is a detailed plan or drawing that shows how to build or construct something, such as a building or a machine.
It provides specific measurements and specifications that need to be followed in order to create the final product. Blueprints are mainly used in architecture and engineering.
In summary, blueprints are used to show how to build or construct something, while diagrams are used to illustrate relationships or processes.
単語を開く: Blueprint →A chart is a visual representation of data that is usually presented using tables, graphs, or other visual elements.
It is used to organize and present information in a clear and concise way. Charts are commonly used in business, finance, and marketing to help people understand trends, patterns, and relationships in data.
It is used to illustrate complex ideas or concepts, and can range from simple diagrams like flowcharts to more complex ones like blueprints or maps.
A chart is used to represent data while a diagram is used to represent the structure or workings of something.
単語を開く: Chart →Draw refers to the act of creating a picture or image by hand using a pen, pencil, or other drawing tool.
The word diagram refers to a technical drawing or chart that is meant to convey specific information. It typically involves using specific symbols and labels to represent different pieces of information or data, and is often used in fields like engineering, mathematics, and science.
You might use draw when you are creating a picture for artistic or decorative purposes, and diagram when you are creating a technical drawing to convey specific information or data.
単語を開く: Draw →A graph is a type of diagram that uses dots, lines or bars to represent data points or values.
A diagram is used to illustrate complex processes or ideas, while a graph is used to represent numerical data in a visual and easy-to-understand way.
単語を開く: Graph →A diagram is a simplified illustration of something that shows its key features or components, while a map is a visual representation of a geographic area that includes various features like roads, landforms, and bodies of water.
Maps are mainly used to help people navigate a physical space. They can be used to show cities, countries, or even entire continents.
Maps can also display topography, political boundaries, and natural features like rivers and forests. They are important tools for travel, urban planning, and geography.
単語を開く: Map →An outline is a written plan that shows the logical structure of something, such as an essay, speech, or story. It typically includes headings or bullet points that organize the main ideas and supporting details.
Outlines are often used in language arts classes or any situation where someone needs to organize their thoughts before writing.
A diagram is a visual representation while an outline is a written plan. They are both helpful tools for organizing information, but each is used in different contexts.
単語を開く: Outline →A plan is a detailed strategy or outline for achieving a specific goal. For example, a building plan shows the layout and design of a building.
People use plans to organize and guide their actions towards a specific goal.
A diagram is used to show how things work or are related to each other, while a plan is used to guide actions towards a goal.
単語を開く: Plan →A schematic is a more technical diagram that shows the underlying components and connections of an electrical or mechanical system.
A schematic is typically used in engineering and electronics to illustrate how a device or system works.
In summary, diagrams are used to represent something in a simple form while schematics are used to illustrate the inner workings of technical systems.
単語を開く: Schematic →other people's renewables, so we could go back and talk very politely to the people in the top left-hand side of the diagram and say, "Uh we don't want renewables in our backyard, but um please could we put them in yours instead?" And that's a serious option. It's a way for the world to handle this issue.
YouTube で見る ↗Whenever you say you're a physicist, there's a certain fraction of people who immediately go, 'Oh, I hated physics in high school.' That's because of the terrible influence of high school physics. Because of it, most people think physics is all about inclined planes and force-vector diagrams.
That's an important difference because it marks two completely different morphologies. This confusion makes many students wary of the heart in biology lessons, thinking it signals an intimidating subject full of complicated names and diagrams. Only those who end up studying medicine
YouTube で見る ↗The chemist, whose science is immediately concerned with the combinations of atoms, has rarely found it necessary to discuss their shapes, and gives them no particular forms in his diagrams. That does not mean that the shapes are unimportant, but rather that the older methods could not define them.
knowledge from two different parts of the world of science from two radically different approaches to exploration what could - such seemingly divergent areas of inquiry have in common as we create a virtual Venn diagram of the evening in
YouTube で見る ↗The Government are very keen on amassing statistics - they collect them, add them, raise them to the nth power, take the cube root and prepare wonderful diagrams.
so we never want to put that sort of diagram in front of people and so instead it evolved through some back-and-forth with design and development to something here where it's a little bit more structured and then finally what you know winds up in that the actual final version so encourage
YouTube で見る ↗My whole background is character acting: weird costumes, fat suits, playing men, playing animals - I've never played anyone with whom there's any overlapping Venn diagram.
just like soldering all night and looking at his diagram of you know and and i was standing over him going and finished yet have you finisher and so he was just working all night to create this time-lapse kit and link it up and to see whether it was going to work it was all guesswork as to what might happen
YouTube で見る ↗Concern for man and his fate must always form the chief interest of all technical endeavors. Never forget this in the midst of your diagrams and equations.
that I think has this huge potential to change the world. And this is what it is. This is a small modular reactor. So it's not as big as the reactor you see in the diagram here.
YouTube で見る ↗I used to be really cute. I could send you earlier photos where I'm stunning. But I've gained about twenty pounds over the past two years, and the more weight I've put on, the more success I've had. If you drew a diagram of weight gain and me getting more work, a mathematician would draw some conclusions from that.
No need to flip through at all. The edge of this flip book is known as a space-time diagram of Andrew's journey through you guessed it, space and time. We call the line that represents Andrew's journey his world line.
YouTube で見る ↗Having marshalled the men in battle order, as shown in the first diagram, you will observe that each party has two ranks of men, on the first of which stand the superior Pieces, and on the next the eight Pawns.
Like that focus graph a lot of the teachers said, "I have a feeling a lot of the kids are jumping around and not focusing on one topic." So we made that focus diagram. So it's all been teacher-driven. It's been pretty crazy. Is this ready for prime time? Do you think a lot of classes next school year should try this thing out?
YouTube で見る ↗There are some aspects of the diagram that I wish I had expressed a little more clearly.
to country size other people's renewables so we could go back and talk very politely to the people in the top left-hand side of the diagram and say we don't want renewables in our backyard but please could we put min yours instead and that's a serious option it's a way for the world to to handle this
YouTube で見る ↗I never take any notes or draw charts or make elaborate diagrams, but I hold an image of the shape of a book in my head and work from that mental hologram.
and work next year may not look like work last year. So which one of these sounds like the world we're increasingly living in? In fact our need to think in an adaptable manner and to keep track of interconnecting parts has fundamentally changed our perception, so that when you look at this diagram,
YouTube で見る ↗I think by drawing, so I'll draw or diagram everything from a piece of furniture to a stage gesture. I understand things best when they're in graphics, not words.