chart
noun chart
tʃɑːrt
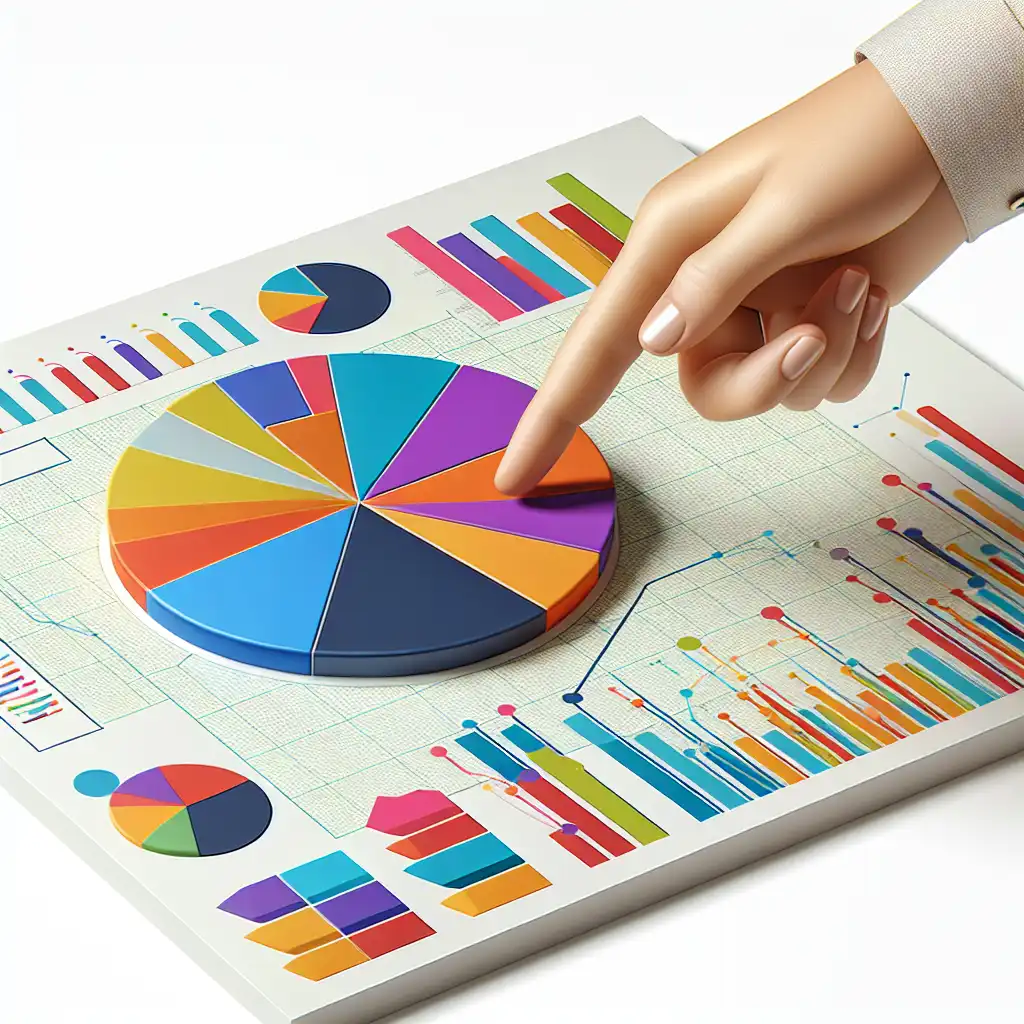
A visual display of information, usually in the form of a diagram, graph, or table
The teacher showed a pie chart to explain the budget distribution
chart
tʃɑːrt
加载中…
tʃɑːrt
A visual display of information, usually in the form of a diagram, graph, or table
The teacher showed a pie chart to explain the budget distribution
tʃɑːrt
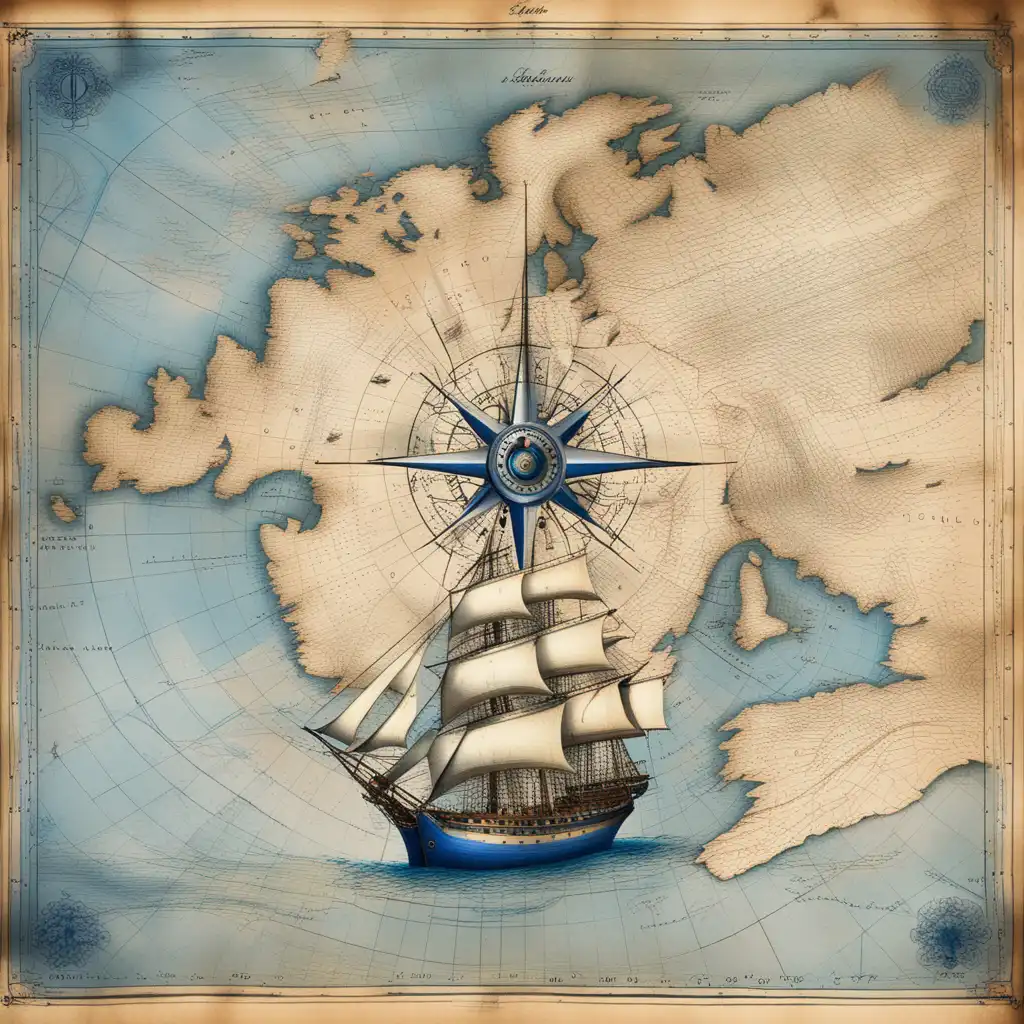
A map for navigation, especially at sea
The captain used a chart to navigate the sea

tʃɑːrt
To record or track progress or development
The student charts her progress in learning English

tʃɑːrt
To plan or map out a course of action
He charted a course for his new business start-up

tʃɑːrt
A ranking of popular music or other items or people
Her new song was on the top of the charts
音频无法加载,请稍后再试。
The word 'chart' usually refers to a visual way of representing data or information. It can be used to organize and display information in a clear and easy-to-read way. For example, a weather chart might show the temperature and precipitation for each day of the week. A growth chart might show a child's height and weight over time. A flow chart might show the steps in a process, like how to make a sandwich. Charts can be used in many different settings, like in schools, businesses, and scientific research. They can be created by hand or using computer software. Overall, if you need to represent information in a clear and organized way, a chart might be a helpful tool to use.
A blueprint is a detailed plan or design that shows the dimensions and layout of a building or machine.
A blueprint is used in the construction or production process while a chart is used to represent and interpret data or information.
打开单词: Blueprint →A diagram is a drawing or plan that shows the structure or workings of something.
It is used to illustrate complex ideas or concepts, and can range from simple diagrams like flowcharts to more complex ones like blueprints or maps.
Diagrams are commonly used in engineering, science, and architecture to help people understand how things work.
A chart is used to represent data while a diagram is used to represent the structure or workings of something.
打开单词: Diagram →The words chart and graph both refer to a visual representation of data or information.
A graph is a type of chart that is specifically used to display quantitative data. Graphs are usually used to show relationships between two different variables or sets of data.
Some common types of graphs include scatter plots, line graphs, and histograms.
You can think of charts as a more general term for any type of visual representation of data, while graphs specifically refer to visual displays of quantitative data.
打开单词: Graph →A map is used to display geographic locations or topographical features. It usually shows a geographical area, like a city, state or country, and the location of various features like mountains, rivers, or roads.
In summary, charts are used to show data, and maps are used to indicate geographical locations and features.
打开单词: Map →A plan is a detailed course of action that is used to achieve a goal or objective. Unlike a chart, a plan is not a visual representation of data, but rather a written or verbal outline of the steps that need to be taken to achieve a particular outcome.
Plans are commonly used in project management, business operations, and personal goal setting.
A chart is used to visually represent data or information, while a plan is used to outline the steps that need to be taken to achieve a particular outcome or goal.
打开单词: Plan →Record means to keep a written or electronic account of something that has happened, including events, actions, or results.
It is often used to maintain a history or documentation of past activities, like in the case of medical records or financial records.
Chart is used to display information while record is used to keep information.
打开单词: Record →A schedule is a plan or timetable outlining when and where events or activities will take place. Examples of schedules include school timetables, work rosters, and travel itineraries.
A chart is used to display data in a visual format, while a schedule is used to outline when and where events or activities will take place.
打开单词: Schedule →A table is a set of data arranged in rows and columns. Tables are best used for listing or comparing data points in a structured way.
For example, a table can list the names and ages of students in a class.
In summary, charts are used to visualize trends and comparisons while tables are used to list and compare data in a structured format.
打开单词: Table →Through deep thought Woolf's characters are shown to temporarily transcend their material reality, and in its careful consideration of the complexity of the mind, her work charts the importance of making our inner lives known to each other.
在 YouTube 上观看 ↗One day, the dance charts will be the biggest chart in the music world. Because we all need to dance. This planet will be a fun planet when the judges in court will end the day with a dance!
And let me just say this profits mania that we're on is so deeply entrenched that we don't even realize how we're harming society. Here's a small but startling example of exactly how we're doing this chart shows corporate giving
在 YouTube 上观看 ↗Deep down, I always had a belief I would get on the charts.
life isn't that easy in that straightforward first you have the vision and then you make it possible the joy we have it's just off the chart we love it up there
在 YouTube 上观看 ↗I didn't really chart things out, career-wise.
of management has simply not kept pace in other words business is rapidly involving and worked as not if we were to take apart this pie chart and replace the word email with memo this could represent the life of a worker one
在 YouTube 上观看 ↗I don't chart out the life histories of the people I play. If I did, I'd be in trouble. I work with my heart and my head, and naturally emotions follow.
but the crested horn shark is going to try to make sure that all that time and energy was for absolutely nothing why for reasons you might not expect the crested horn shark looks eerily similar to the port jackson chart making it difficult to tell friend from this power of mimicry allows the crested horn shark to infiltrate port jackson
在 YouTube 上观看 ↗We seek to craft characters who inspire empathy: characters our audience will care for and, as a result, will care about what happens to them and thus will share the journey we have charted. A story, after all, is the character's journey.
is by analyzing movements and trends in society, and charting the paths they are likely to follow into the future with varying degrees of probability. Their work informs the decisions of policymakers and world leaders, enabling them to weigh options for the future
在 YouTube 上观看 ↗No single person can possess the wisdom to chart our course.
And if you plot a data point for these same two dozen sports today it looks like this. The athletes' bodies have gotten much more different from one another. And because this chart looks like the charts that show the expanding universe, with the galaxies flying away from one another,
在 YouTube 上观看 ↗I have a chart for success at school because it gave me a great deal of pleasure. It opened my mind to the world. I learned to read.
as a sort of universal personality test. Employers made prejudiced hiring decisions based on reductive decoding charts. As the test left clinics and entered popular culture its reputation among medical professionals plummeted,
在 YouTube 上观看 ↗I once had a dream and this one familiar god, who was probably one of my master teachers, said, 'You should not worry about being on the charts. That's not important.
Well it surely is a technical detail, but some details really matter. Some details provide windows into uncharted realms of reality, and this peculiar number may be doing just that, as the only approach that's so far made headway to explain it invokes the possibility of other universes --
在 YouTube 上观看 ↗I'm not very interested in charting a day-to-day familiar reality. I'm always looking for territory in which to explore the BIG subjects, the life-or-death stories.
The world is changing with really remarkable speed. If you look at the chart at the top here,
在 YouTube 上观看 ↗As an artist, I don't care about where we are in the charts and all that. The important thing to me is to connect with a creative project.