graph
noun graph
ɡræf
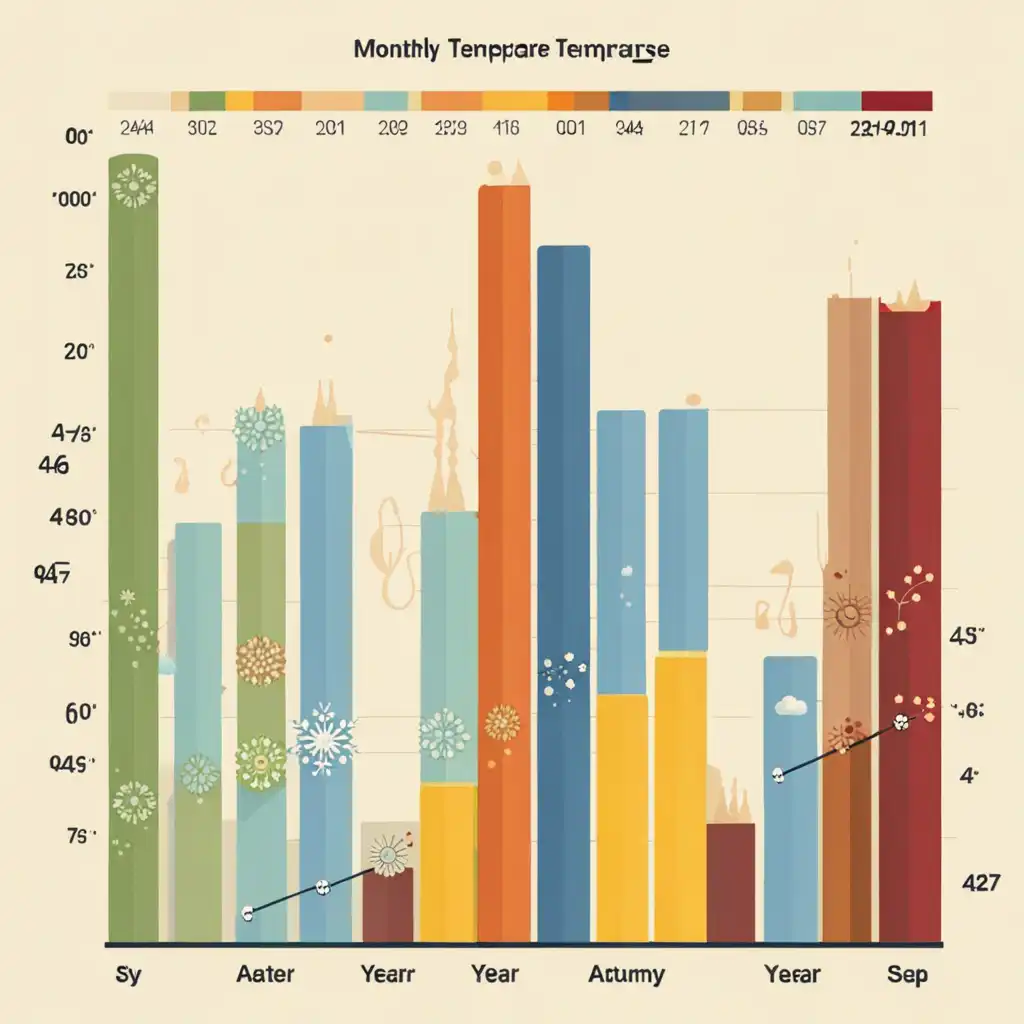
A drawing or picture that shows how different amounts relate to each other
The graph shows changes in temperature over the year.
graph
ɡræf
Cargando…
ɡræf
A drawing or picture that shows how different amounts relate to each other
The graph shows changes in temperature over the year.
ɡræf
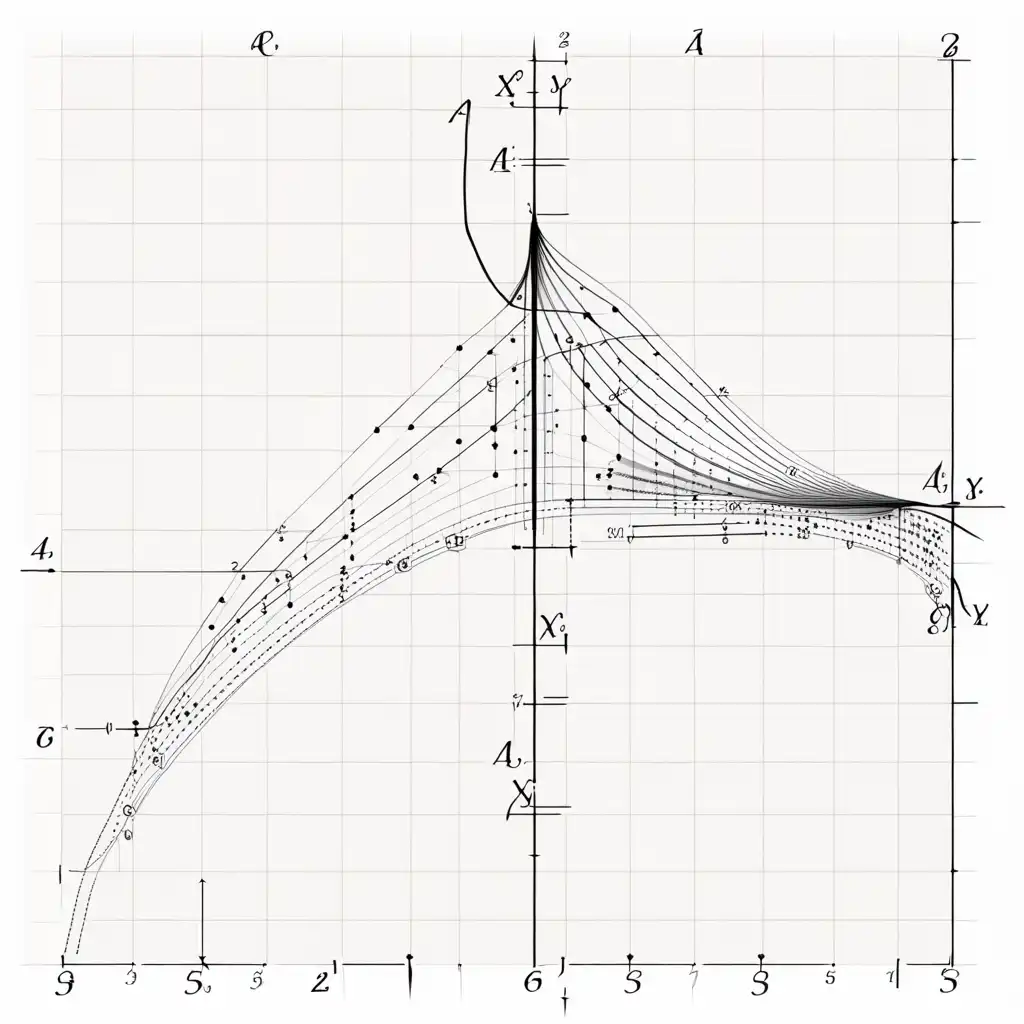
In mathematics, a structure that connects points with lines
This is a graph of a function.
ɡræf
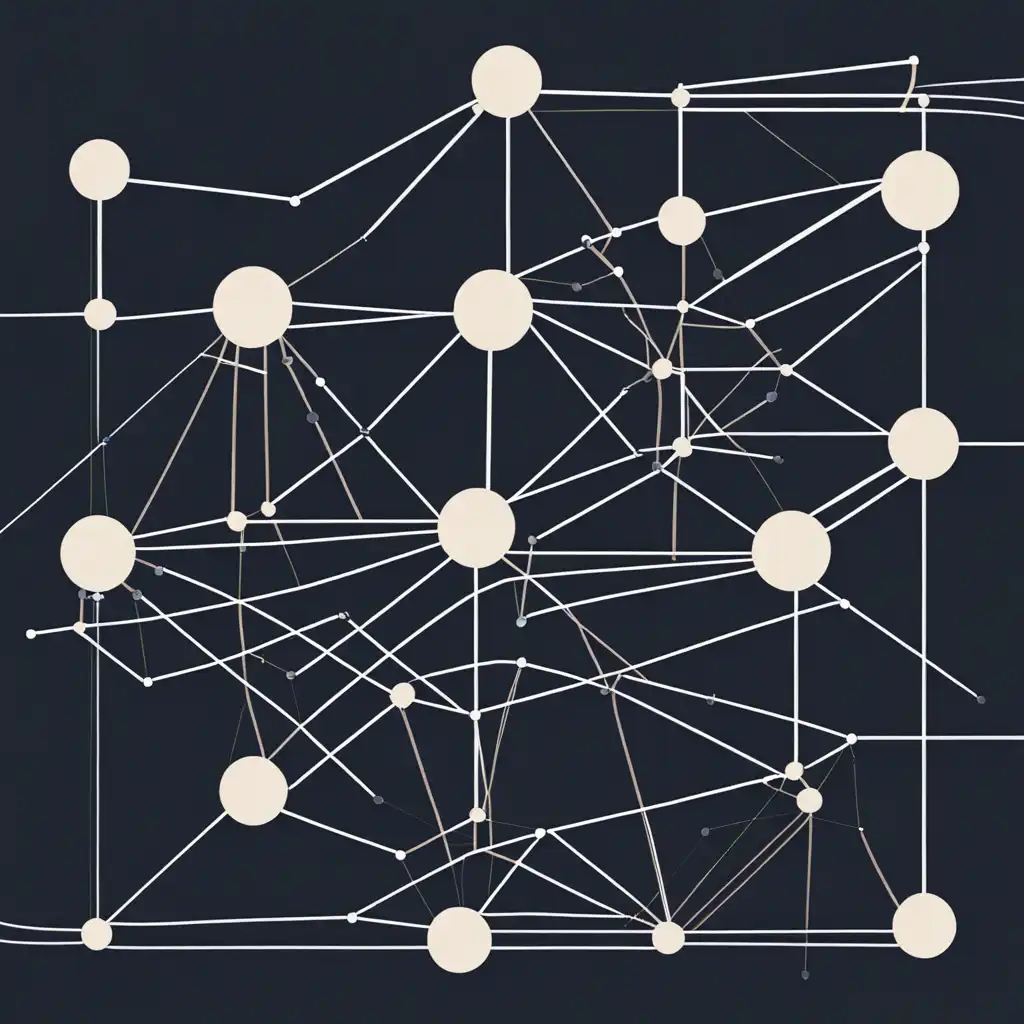
In computing, a way of representing data that shows the relationships between different items
In computer science, a graph is used to represent networks of communication, data organization, computational devices, the flow of computation, etc.
ɡræf
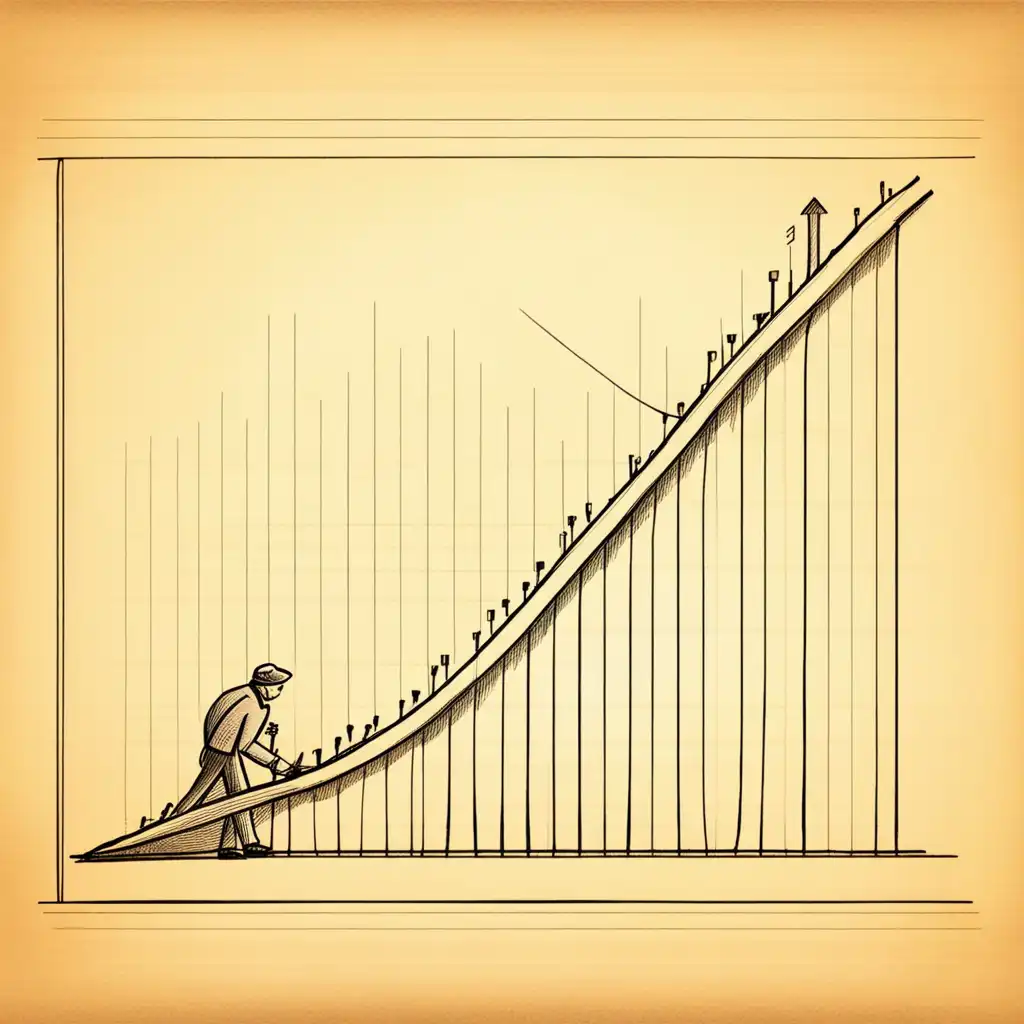
To draw a graph, or to show something using a graph
We graphed the population growth over the centuries.
No se pudo cargar el audio. Inténtalo de nuevo más tarde.
The word 'graph' can refer to a diagram that shows information in a visual way. It is used in many different areas, such as math, science, and business. For example, if you want to show how the temperature changes over time, you might create a graph that plots temperature on the vertical axis and time on the horizontal axis. In a business context, a graph might show sales figures or market trends. Overall, 'graph' is a useful word to know when you want to display information visually.
The words chart and graph both refer to a visual representation of data or information.
A chart is usually used to show information that is organized in a table or list format.
Charts can take many different forms, including line charts, bar charts, pie charts, and more.
A graph is a type of chart that is specifically used to display quantitative data. Graphs are usually used to show relationships between two different variables or sets of data.
You can think of charts as a more general term for any type of visual representation of data, while graphs specifically refer to visual displays of quantitative data.
Abrir palabra: Chart →A diagram is a labeled illustration with lines and shapes that represent different things.
A graph is a type of diagram that uses dots, lines or bars to represent data points or values.
A diagram is used to illustrate complex processes or ideas, while a graph is used to represent numerical data in a visual and easy-to-understand way.
Abrir palabra: Diagram →Figure is generally used to refer to any type of visual object or representation, such as a diagram, chart, photograph, or illustration.
The term graph specifically refers to a type of figure that is used to represent data or information in a visual format, typically through the use of lines, bars, or other symbols.
In application, a figure can be used to illustrate a wide range of information, while graphs are specifically used to represent numerical data or relationships.
For example, a figure might include a map showing the location of different countries or a picture of a molecule.
Abrir palabra: Figure →Graphic can refer to any kind of visual representation or design, not just those used to represent data. For example, a graphic can be a drawing, picture or icon used to illustrate a concept or idea.
Graph is typically used to refer to a specific type of visual representation of data, while graphic is a broader term that can refer to any type of visual design or representation.
Abrir palabra: Graphic →A map is a visual representation of geographical areas.
Maps can show physical features like landforms and bodies of water, political boundaries, or even social and economic data such population density, income, or education levels.
Maps can be used for navigation, planning or analyzing data related to a specific location.
So, in summary, graphs are used to represent numerical data while maps show geographic features or data. Both graphs and maps can be used to convey information in a clear and visual way.
Abrir palabra: Map →Graph and plot are two related but different words used in mathematics, science and statistics to represent data.
A graph is a visual way of representing data through a series of plotted points, connected by lines or curves. It is a way to display information in the form of charts, diagrams or graphs.
Graphs can be used to represent data in various forms, such as line graphs, bar graphs, pie charts, scatter plots, and more.
A plot is a specific type of graph that visualizes the relationship between two variables. It is a way to show the relationship between two or more variables by representing them on a coordinate plane.
Plots can be used for various purposes in different fields such as science, engineering, economics, and social sciences.
In summary, graphs are used to represent data in various forms, while a plot is a specific type of graph used to visualize the relationship between two variables.
Abrir palabra: Plot →Representation refers to the way something is presented or depicted.
It can apply to many things, including images, art, and even ideas. In the context of graphs, representation refers to how the data is presented, such as the type of graph used, the colors or symbols used to represent different data points, etc.
Graph refers to the visual display of data, while representation refers to the way the data is presented. Both words are applicable in subjects like math and science, but representation can also be used in other areas where information is presented visually.
Abrir palabra: Representation →A table is a set of data arranged in rows and columns. It displays information in a structured and organized format, making it easy to compare and analyze different data points.
Tables are most commonly used to display numerical data, but they can also be used for text-based information, such as names or descriptions.
A graph is most useful when trying to show trends or patterns in data, while a table is most useful for presenting and comparing numerical data.
However, both graphs and tables can be used in a variety of contexts, depending on the specific needs of the user.
Abrir palabra: Table →How to spot a misleading...
Ver en YouTube ↗What people see is just your career graph and the films you do. But that's a very small aspect of my life.
Avi Rubin: All your...
Ver en YouTube ↗My son has been wiser than me in terms of his career graph. He saw to it that he became a star first and start to get all the roles that he wanted to do.
This Crazy Tree Grows 40...
Ver en YouTube ↗Dubbing can change the 'sur' of the character. Doing it for another actor and to make it believable is tricky but interesting because you do not know the graph of the character.
What would you do if...
Ver en YouTube ↗As an actor, you want to do different things. You don't want to do same kind of stuff. I like the characters I play to have a graph.
Hide and Seek with the...
Ver en YouTube ↗The world of digital media is being transformed. A bunch of new businesses can be reinvented, thanks to social graphs, the mobile internet, and the new shopping habits of the young. Those are going to create a whole generation of cool new companies.
Could we create dark...
Ver en YouTube ↗Think about spam filters; if email didn't come from someone that someone you know knows, that's an important signal, and one we could embed in the environment; we just don't. I just want the world to be filtered through my social graph.
David Mackay: A reality...
Ver en YouTube ↗Facebook isn't helping you make new connections, Facebook doesn't develop new relationships, Facebook is just trying to be the most accurate model of your social graph. There's a part of me that feels somewhat bored by all of this.
Sean Gourley on the...
Ver en YouTube ↗Facebook is the social graph with the organizing principle around your friends and your social life. LinkedIn is the professional graph, organized around you, your job, your industry, your title and your function. At Chegg, we are building a student graph centered around you, as a student.
Can you solve the...
Ver en YouTube ↗Every dance is a kind of fever chart, a graph of the heart.
Einstein's twin paradox...
Ver en YouTube ↗You have to write your own story, your own graph and rhythm.